On October 8, 2021, we released version 1.15 of our Kieker framework for application performance monitoring and dynamic software analysis. As usual, the release is available for download at https://kieker-monitoring.net/download/.
Continue readingCfP/CfPart: 12th Symposium on Software Performance (SSP 2021) will take place in Leipzig
The 12th Symposium on Software Performance (SSP 2021) will take place in Leipzig, Germany on November 9-10, 2021. It will be a joint meeting of the Descartes, Kieker, and Palladio research groups.
In addition to invited talks from practitioners and researchers, we welcome contributions from academic, scientific, or industrial contexts in the field of software performance, including but not limited to approaches employing Descartes, Kieker, and/or Palladio.
We solicit technical papers (5-6 pages, CEUR-WS format) and extended abstracts for industry or experience talks (maximum 700 words).
Details are provided on the symposium web site: http://www.performance-symposium.org/
Report from the 11th Symposium on Software Performance
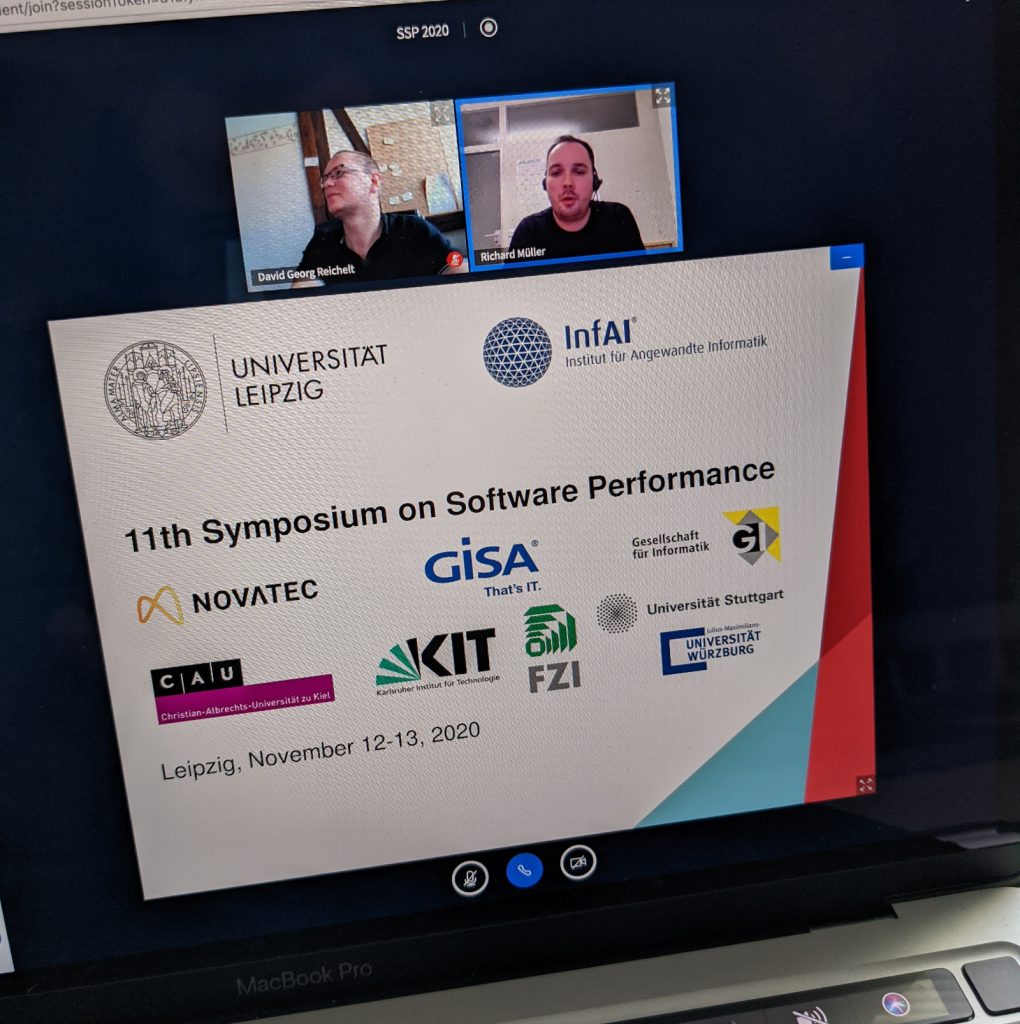
The 11th Symposium on Software Performance (SSP ’20), was held as an online event from November 12 to 13, 2020. Every year, the SSP brings together researchers and practitioners interested in software performance and related quality attributes. The scope of SSP spans measurement, modeling, benchmark design, and run-time management. SSP 2020 was planned to take place in Leipzig, Germany. Unfortunately, due to the Covid-related circumstances, a physical meeting was not possible.
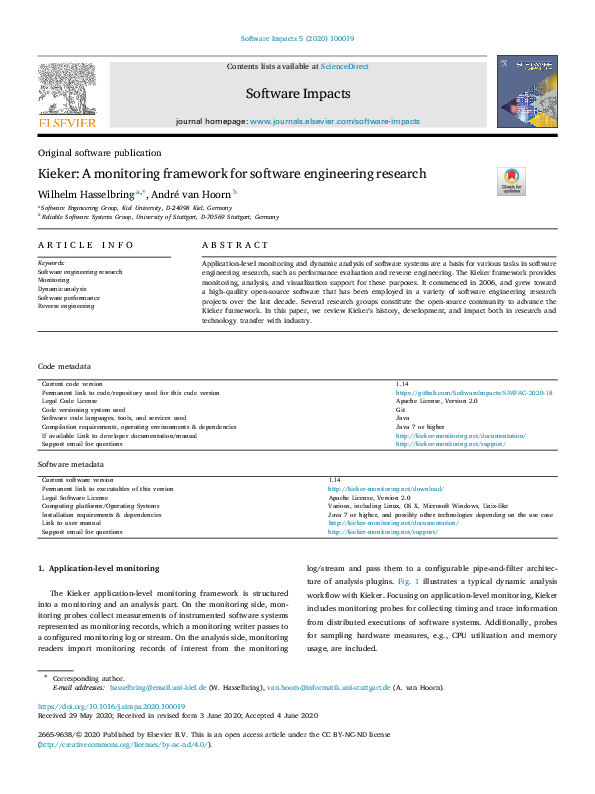
New article reflecting on Kieker’s history, development, and impact
A new article in the Software Impacts journal reflects on Kieker’s history, development, and impact both in research and technology transfer with industry.
The article is available as open access: https://doi.org/10.1016/j.simpa.2020.100019
Kieker 1.14 released
On May 12, 2020, we released version 1.14 of our Kieker framework for application performance monitoring and dynamic software analysis. As usual, the release is available for download at https://kieker-monitoring.net/download/.
Continue readingCfP/CfPart: 11th Symposium on Software Performance (SSP 2020) will take place in Leipzig
The 10th Symposium on Software Performance (SSP 2020) will take place in Leipzig, Germany on November 5-6, 2020. It will be a joint meeting of the Descartes, Kieker, and Palladio research groups.
In addition to invited talks from practitioners and researchers, we welcome contributions from academic, scientific, or industrial contexts in the field of software performance, including but not limited to approaches employing Descartes, Kieker, and/or Palladio.
We solicit technical papers (maximum 3 pages) and extended abstracts for industry or experience talks (maximum 700 words).
Details are provided on the symposium web site: http://www.performance-symposium.org/
Report from the 10th Symposium on Software Performance
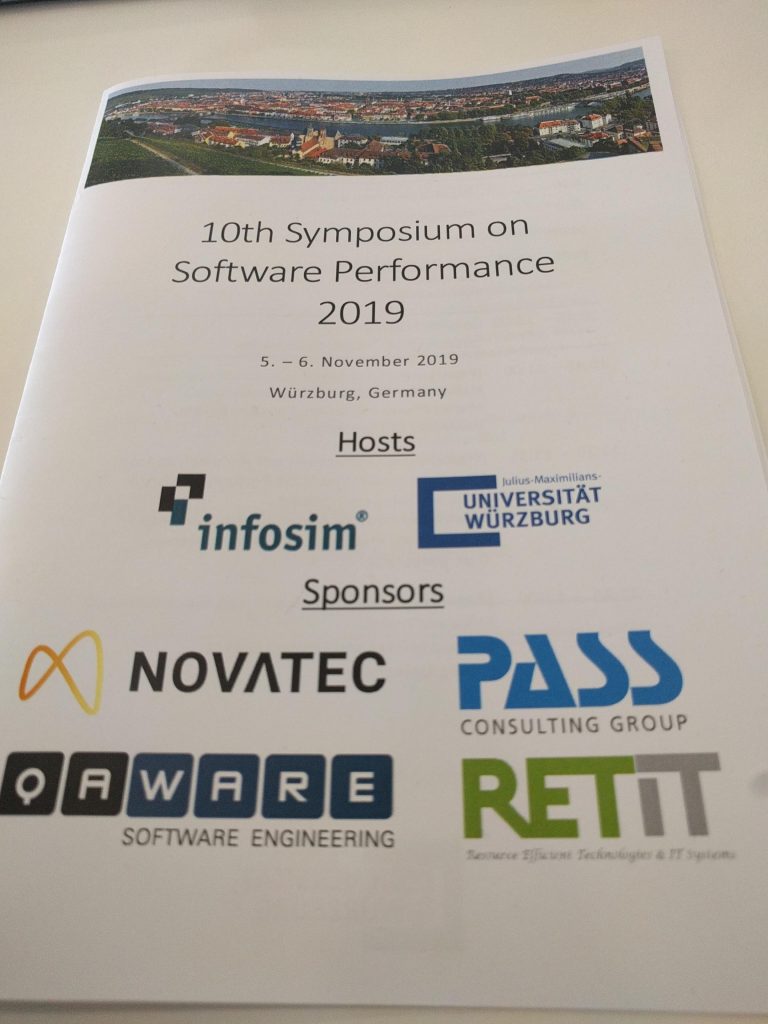
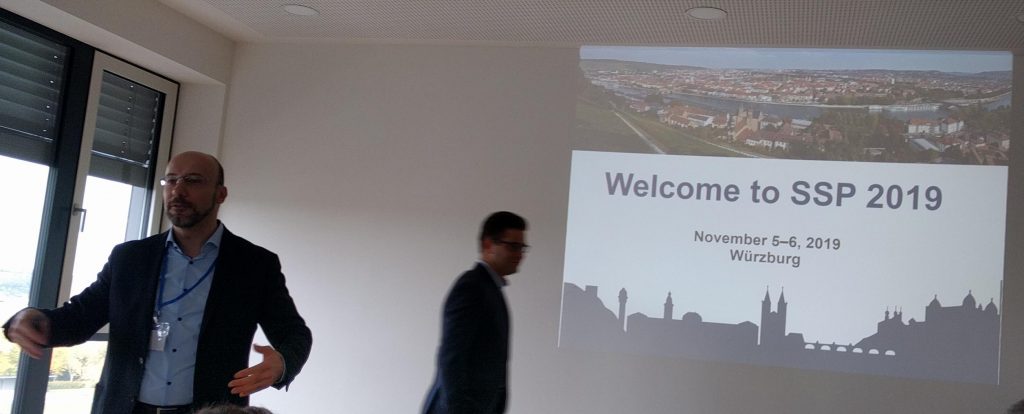
The 10th Symposium on Software Performance (SSP ’19), was held in Würzburg, Germany, from November 4 to 6, 2019. Every year, the SSP brings together researchers and practitioners interested in software performance and related quality attributes. The scope of SSP spans measurement, modeling, benchmark design, and run-time management.
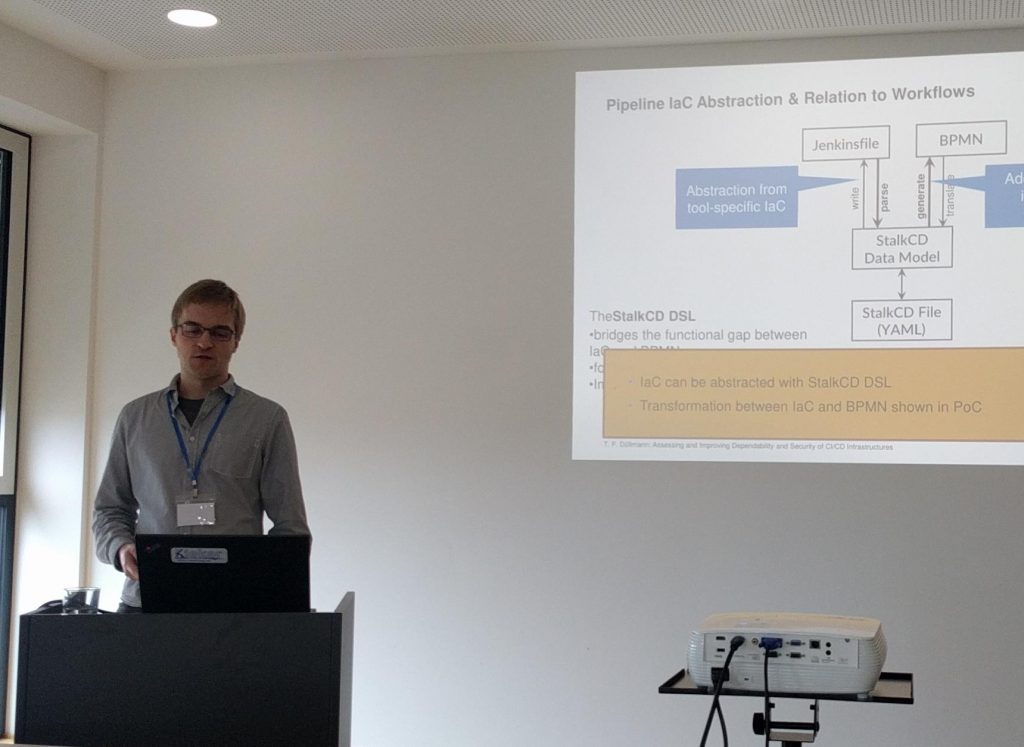
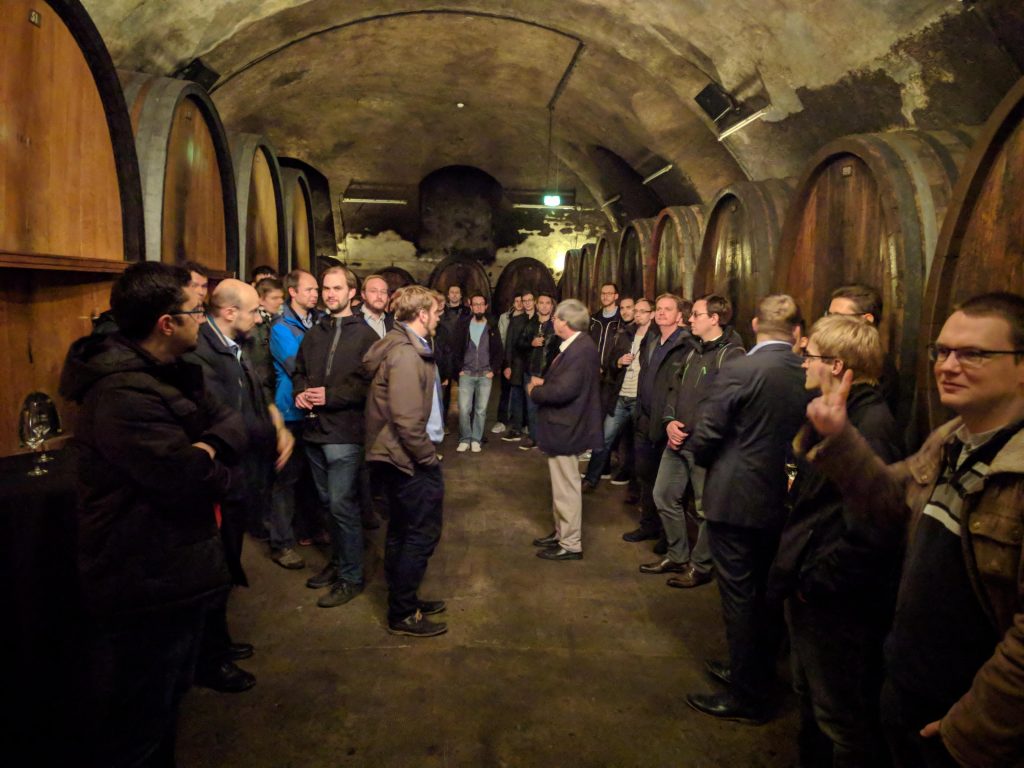
SSP 2019 had a great program that included five invited industry talks and 19 technical presentations. Some of the presentations are accompanied by short papers that appeared in the 2020 (1) issue of Softwaretechnik-Trends (issue to appear online; papers are linked in the program). From a Kieker perspective, it was very nice to see contributions related to Kieker also from other research groups, e.g., from the universities of Mannheim, Munich, and Leipzig. In addition to the technical program, SSP 2019 included an excellent social event, namely a banquet including wine testing in the Würzburg Residence’s historic wine cellar. SSP 2019 attracted about 50 participants from academia and industry.
SSP 2019 was a great event with an excellent organization by our colleagues from the University of Würzburg!
The SSP series is organized by the research groups around Kieker, Descartes, and Palladio, which are located at the universities of Karlsruhe, Kiel, Stuttgart, and Würzburg. The 11th edition of the Symposium of Software Performance will be held in Leipzig, Germany from November 5 to 6, 2020.
New Tools and Stages for Kieker
The Kieker monitoring framework and toolset comprises different monitoring probes utilizing different probe introduction mechanisms for Java and other languages, a wide variety of analysis stages to receive, read and analyze monitoring data, and tools to support handling data and creating analyses based on monitoring data. In recent years we started to use the new pipe-and-filter framework TeeTime for the analysis and tool part which reduces the amount of configuration and implementation code necessary to create your own combination of analyses.
In the iObserve project, we heavily relied on TeeTime and the new Kieker stages (filter) implemented and ported to work with TeeTime. In this process, we created new tools and ported older Kieker tools to TeeTime. Furthermore, we updated the build process to create ready to use packages for these tools. Therefore, users of Kieker tooling do no longer need to download the complete Kieker package and extract the tools they need.
In this article, we will introduce the new stages and tools which originated in iObserve or where first used by iObserve, as the key user for the addition. As these additions are numerous, we will present only a brief overview in this article and add new posts to provide more details to certain new additions.
In case you are in a rush, all the new features can be found in the current Kieker snapshot and will be part of Kieker 1.15.
New Tool Packages
In the past Kieker produced one large distribution package containing all tools, libraries, probes, and setups. This had the advantage to present especially students with an easy way to get all what they need in one download. However, nowadays Kieker is used in more research and commercial projects and people want to have packages for specific tasks. To support this need, we now produce specific packages for tools which can be found here. As our efforts will progress, more tools will be available separately. Documentation to the tools is available on our wiki.
- Trace Analysis Tool allows to analyze call traces through applications
- Convert Logging Timestamps converts timestamps into local time
- Log Replayer allows to replay logs to feed them into analysis services, like iObserve and ExplorViz.
- Collector – Kieker Data Bridge allows to receive monitoring data from different source including TCP/binary, HTTP/JSON, files etc. and stores them in a joint log file or repeats them to another node.
- Resource Monitor
- Trace Analysis — GUI a graphical UI to control the Trace Analysis Tool
- Dot-Pic File Converter Helper script to process output files from the Trace Analysis Tool
Kieker Tools Library
The tools in Kieker are highly configurable. Especially when it comes to reading, receiving or writing monitoring logs or other information. This requires that tools can adapt their pipe-and-filter configuration at startup time. As this can be cumbersome to maintain this adaptive feature in an ever growing number of tools, we collected such functionality in the Kieker tool library, reducing the implementation cost. Therefore, most tools can receive data from any reader implemented in Kieker, e.g., binary TCP (compressed or uncompressed), via REST API and from files in different formats.
Ongoing Changes to the Build System
The Kieker build system was based on an growing ant file in the past. We switched to gradle in 2015. However, many special constructs from the ant file had to be ported to gradle and do not fit typical modern Java gradle project layouts and workflows. Therefore, we slowly migrate to a more canonical layout for the Kieker project. One effect of this migration are the aforementioned tool packages. Furthermore, these changes will enable us to create releases faster and provide better support for releases in the long run.
Documentation
Kieker comes with a tutorial and usage guide in PDF. While this was a practical approach in the past, it is not fitting for today. Therefore, we are moving the Kieker documentation to our wiki pages. In the process, we also upgrade the documentation to reflect the current state of Kieker. The Kieker wiki can be found here.
Further Plans
Our future plans aim to improve build quality, release cycle and delivery of packages. We will also collect new stages (filters) and tools from the iObserve project. Furthermore, we will expand and document existing features of Kieker to support C, Fortran, Python and Javascript with monitoring probes capable to communicate with the collector and all tools using the same adaptive reader stages.
We already support C and at least two ways to instrument C and C++ applications one utilizing Aspect C++ and one utilizing features of the GNU Compiler Collection which supports instrumentation for all gcc supported languages. We have also an old version for Perl and other platforms and languages, which will be made available eventually.
Kieker Performance Charts
In an effort to make performance measurements around Kieker more accessible, we provide now performance benchmarks for Kieker directly on our website. Currently we are evaluating plugins which suits our needs and can be integrated with our Jenkins build.
CfP/CfPart: 9th Symposium on Software Performance (SSP 2018) will take place in Hildesheim
The 9th Symposium on Software Performance (SSP 2018) will take place in Hildesheim, Germany on November 8-9, 2018. It will be a joint meeting of the Descartes, Kieker, and Palladio research groups.
In addition to invited talks from practitioners and researchers, we welcome contributions from academic, scientific, or industrial contexts in the field of software performance, including but not limited to approaches employing Descartes, Kieker, and/or Palladio.
We solicit technical papers (maximum 3 pages) and extended abstracts for industry or experience talks (maximum 700 words).
Details are provided on the symposium web site: http://www.performance-symposium.org/
