In our master project, we used STAN4j and Visual Paradigm to carry out a static analysis of Kieker 1.7 and rebuild its architecture. As shown in Figure 1, Kieker consists of four components named common, monitoring, analysis, and tools.
Figure 1 also shows the dependencies between these four components. The three components tools, analysis, and monitoring strongly depend on the common component. The tools component also strongly depends on the analysis component. The two components analysis and monitoring have no interdependencies.
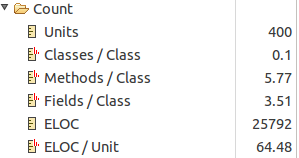
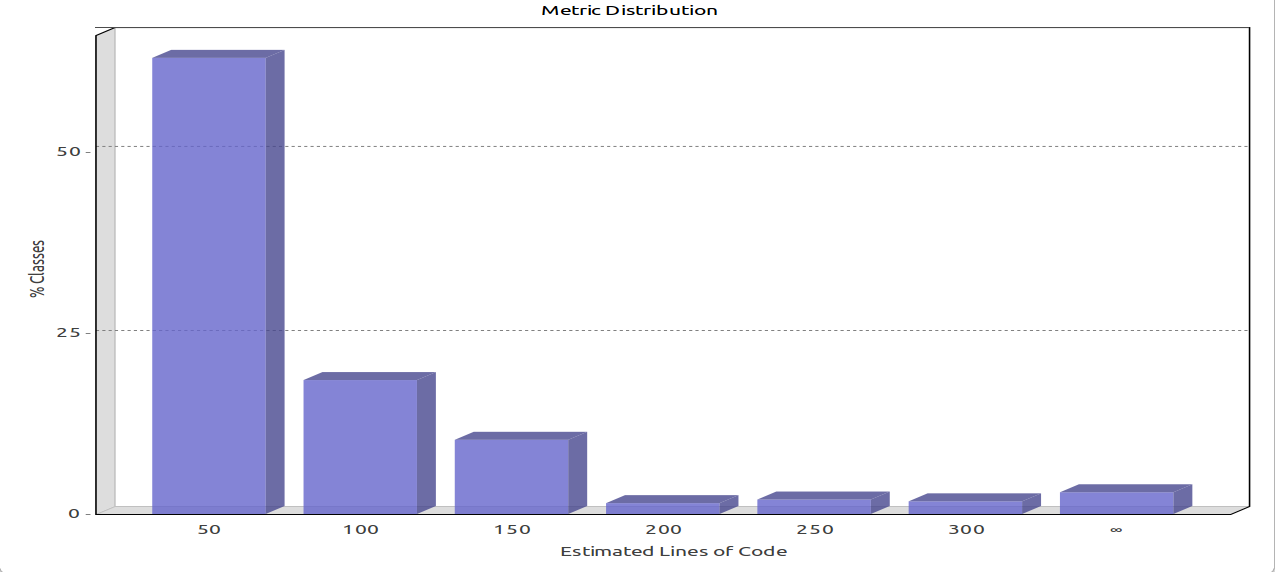
As Figure 2 shows, Kieker consists of 400 classes, each containing about 64 lines of code. Figure Figure 3 shows the number of lines of code on the x-axis and the percentage of the classes on the y-axis. It shows that 63% of the classes have less than 50 lines of code, 18.5% have 50 to 100 lines of code, 10.25% have 100 to 150 lines of code and only 8.25% of the classes have more than 150 lines of code.
Common
The common component represents the data base which is used by the other components. An essential part of this component are the records. A record corresponds to a data set that is created by the monitoring component and evaluated by the analysis component. In addition, the package includes a RecordPipe for direct connection of the monitoring and analysis component, a configuration logger class and several classes for the Kieker internal logging.
As an example of a record, Figure 5 shows a class diagram of the OperationExecutionRecord. Using this data type, data of a method call can be recorded.
Monitoring
An overview of the monitoring component can be seen in Figure 6. The package monitoring.probes includes classes with which the source code of the observed system can be extended to produce the desired records. The monitoring.sampler.sigar package contains classes to collect system information such as CPU and memory utilization. Combined with the response times of the application, statements about the scale of the system can be derived, for example. The monitoring.timer package contains classes for time configuration, while the monitoring.annotation package provides annotations for instrumenting source code. The more comfortable and easier solution is the AspectJ configuration, since no manual interventions in the source code are necessary.
Figure 7 shows the monitoring.writer package, which includes various writers, with which the data can be flushed. Data can be stored to a database or the file system, or they can be forwarded through JMX, JMS, or a pipe. The monitoring.core package contains classes used to configure and control.
Figure 8 illustrates the classes and their dependencies of the package kieker.monitoring.core.controller. The MonitoringController includes seven special controllers and implements their interfaces. It thus forms the core of the monitoring component, with most tasks only delegated. This division of the controller leads to classes whose code is easier to grasp and therefore to understand.
The Writer Controller is responsible for recording the data and is therefore considered in more detail in Figure 9. In this diagram, the data flow of the monitoring component is shown. On the left a record is generated by a probe, in this example an OperationExecutionRecord. This is forwarded via the MonitoringController and the WriterController to the Writer. In this example to a PipeWriter that writes the record in a pipe. The colored rectangles mark the replaceable components, so that the framework can be easily adapted.
Figure 10 shows this data flow within the monitoring component based on a sequence diagram. In this example, an application has been instrumented with AspectJ. For writing the records, the PipeWriter was chosen. When calling a method, an OperationExecutionRecord is created and via the method newMonitoringRecord() sent to the MonitoringController. This delegates the record to the WriterController. This checks whether the monitoring is active and adds a logging timestamp to the record. Then the record is forwarded to the PipeWriter. The PipeWriter writes the record to the pipe, thence will the record forwarded for analysis.
Analysis
The analysis component consists of an AnalysisController and the packages listed in Figure 11. The major components for analysis are Repositories and PlugIns. A PlugIn can be a Reader or a Filter.
Figure 12 shows the exact dependencies. The AnalysisController contains any number of Repositories, Readers, and Filters, where at least one Reader must be present. At this point, the framework can be extended with new Repositories, Readers, and Filters. For the available Writers in the monitoring component, the corresponding Readers exist.
An analysis is assembled by repositories, readers, and filters. These are registered to the controller and then linked. In the following example, a PipeReader, a TypeFilter, and a ListCollectionFilters were registered to the AnalysisController. With the connect method of the AnalysisController the OutputPort of the PipeReader was connected to the InputPort of the TypeFilter, and the OutputPort of the TypeFilter was connected to the InputPort of the ListCollectionFilter. Figure 13 shows a possible data flow in the analysis component based on a sequence diagram. The example from the monitoring component is continued here. The record is sent from the Pipe to the PipeReader. This passes the record to its associated PlugIns(Filter,Repositories) that accept the appropriate record type. A pipes-and-filters architecture of the analysis can be detected here.
Tools
The tools component is mainly an extension of the analysis component. This is reflected in the dependencies between the components, see Figure 1. Figure 14 gives an overview of the tools component. The primary functionality is hidden in the package traceAnalysis.
The Filters are the most important part of the analysis and take a large part in the tools component. Figure 15 shows all existing filters. The number of Filters gives an impression of the existing possibilities of analysis. The structure confirms the impression that you can easily expand Kieker.

