
An article by Nils Ehmke
While the Kieker Monitoring Framework is very suitable for collecting huge amount of monitoring data of your application, the question arises, how these monitoring logs can be analyzed. The tools shipped with Kieker (like the trace analysis tool) can help you only partially, because most of them build upon graph representations which tend to become huge, complex, and incomprehensible for larger applications.
To support the performance analysis of your application, we developed the Kieker Trace Diagnosis tool including a graphical user interface, which we want to introduce in this blog post.
The platform-independent JavaFX-based application allows to import large monitoring logs and prepares them in tree and table form. Even monitoring logs with millions of method calls and hundreds of thousands of traces can still be imported and searched in.
The tool consists of mainly four views. The precise appearance of those can differ, depending on your settings. The traces view might be the most import view. It shows the reconstructed traces of your monitoring logs. The traces view provides, like the other views, various search parameters to narrow the points of interest down. For instance, you can search for specific method calls, for exceptions, and timestamps. You can also sort the traces, giving you the possibility to detect slow traces very quickly.

The settings allow you also to aggregate method calls in the traces. This is useful if your trace has several thousand method calls, but, for example, only the slowest fifty are interesting. The precise type of aggregation can be chosen in the settings.
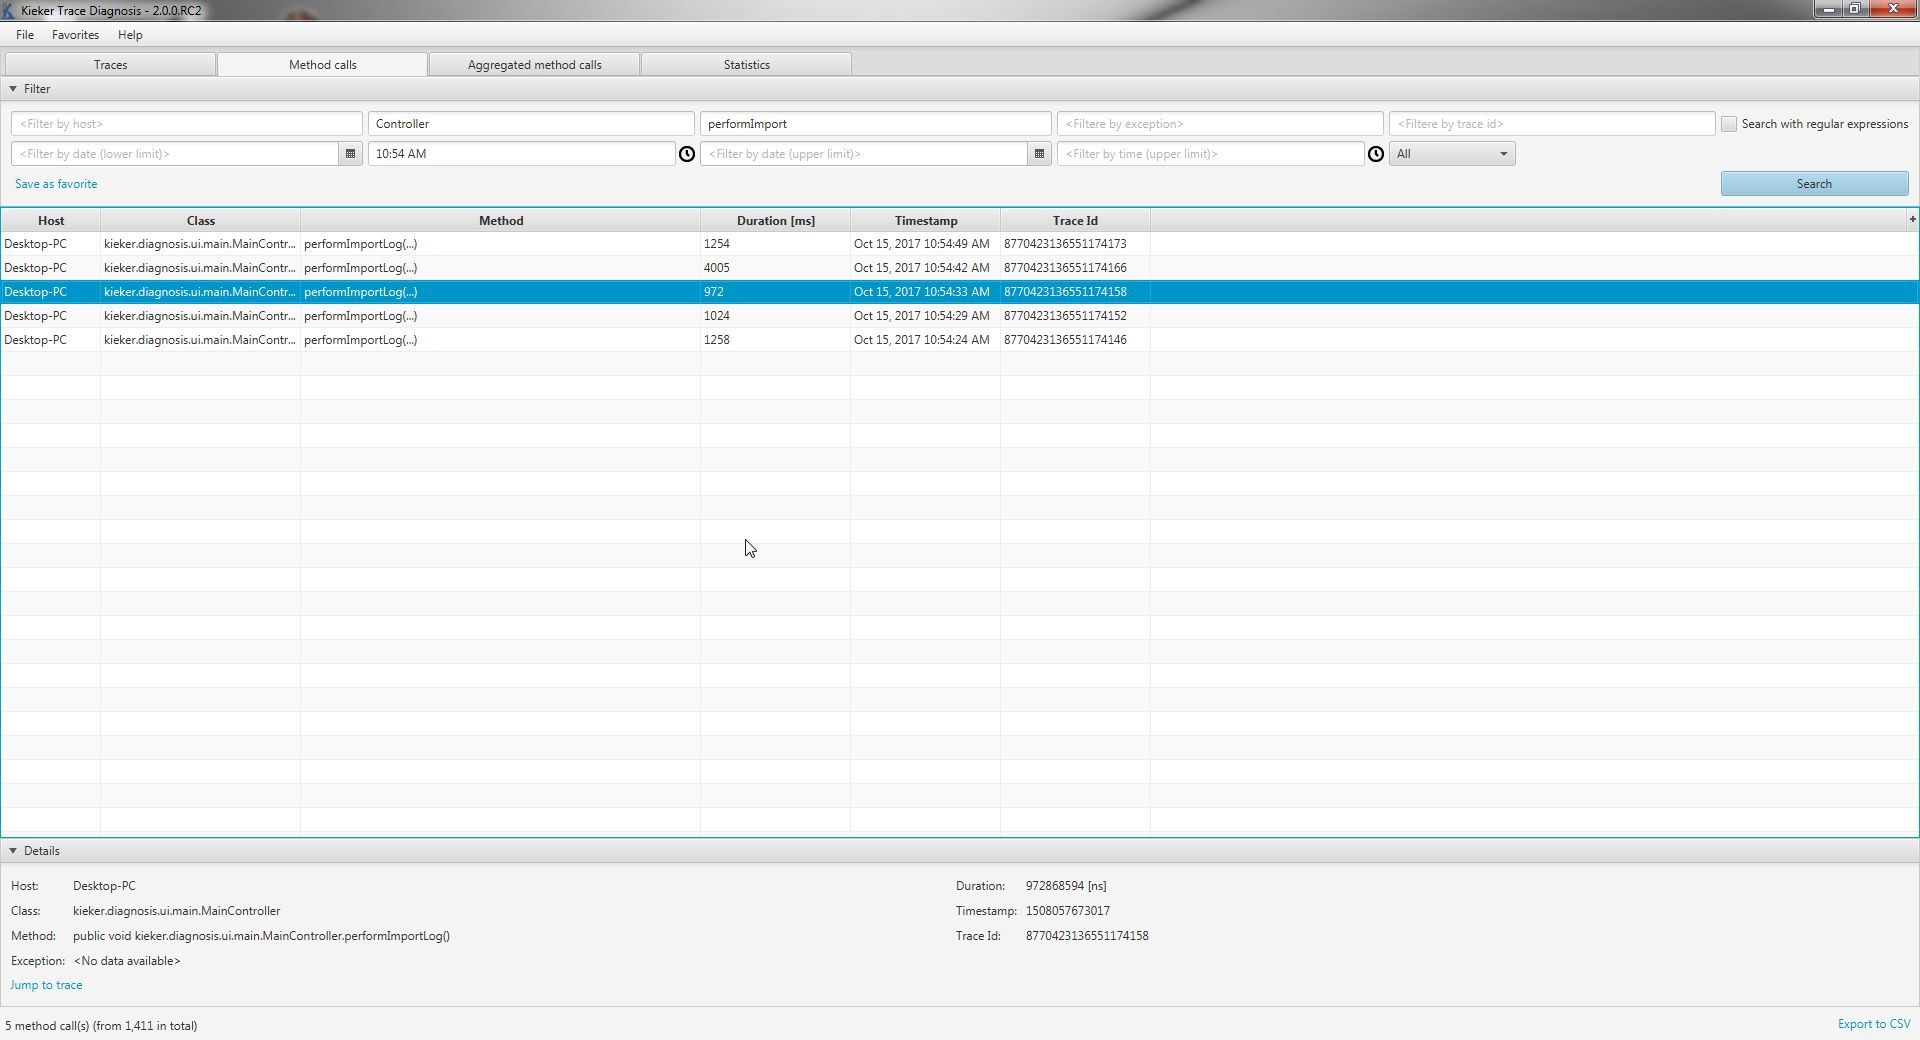
The second view is the method calls view. It displays each single method call from the reconstructed traces and, again, allow to search in the millions of method calls. This view is often the start point of the analysis, as it allows you to identify the slowest method calls in a quick manner. As you might very often want to find the corresponding trace to the method call, we added a button in the details panel to jump directly into the trace in the traces view.
In case you want to work with the data outside of the tool (now why would you want this?), we added also a button to export the visible data into a CSV file.
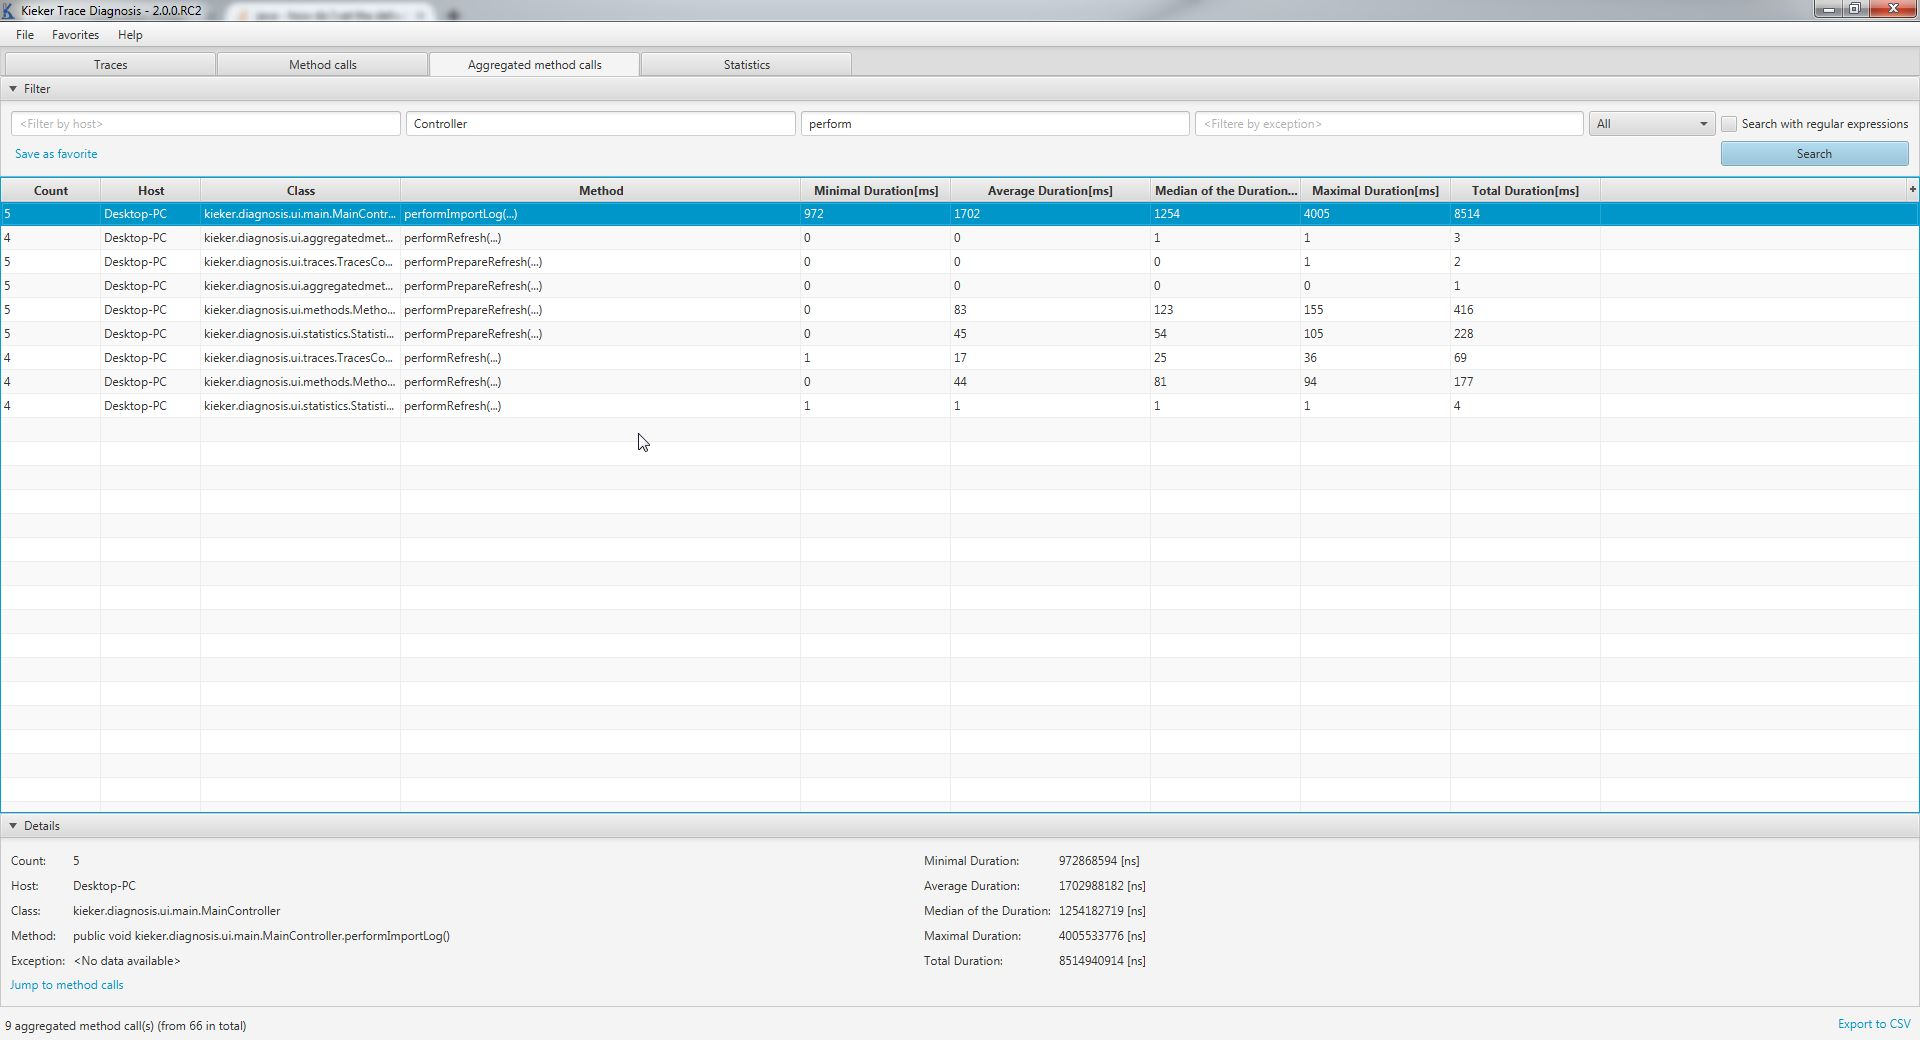
The third view is the aggregated method calls view. It aggregates all method call with identical host, class, method, and exception into a single call and provides information like the number of calls, the average duration, and the total duration. This helps you in finding out, whether there is a specific method call in your application, which consumes a lot of total time. Or is usually very fast, but in one out of ten calls it has a much higher duration. As you might be interested in finding the method calls behind an aggregated method call, we provided a button to jump into the method calls view and display the corresponding method calls in there.
As for the method calls view, we added a button for a CSV export.
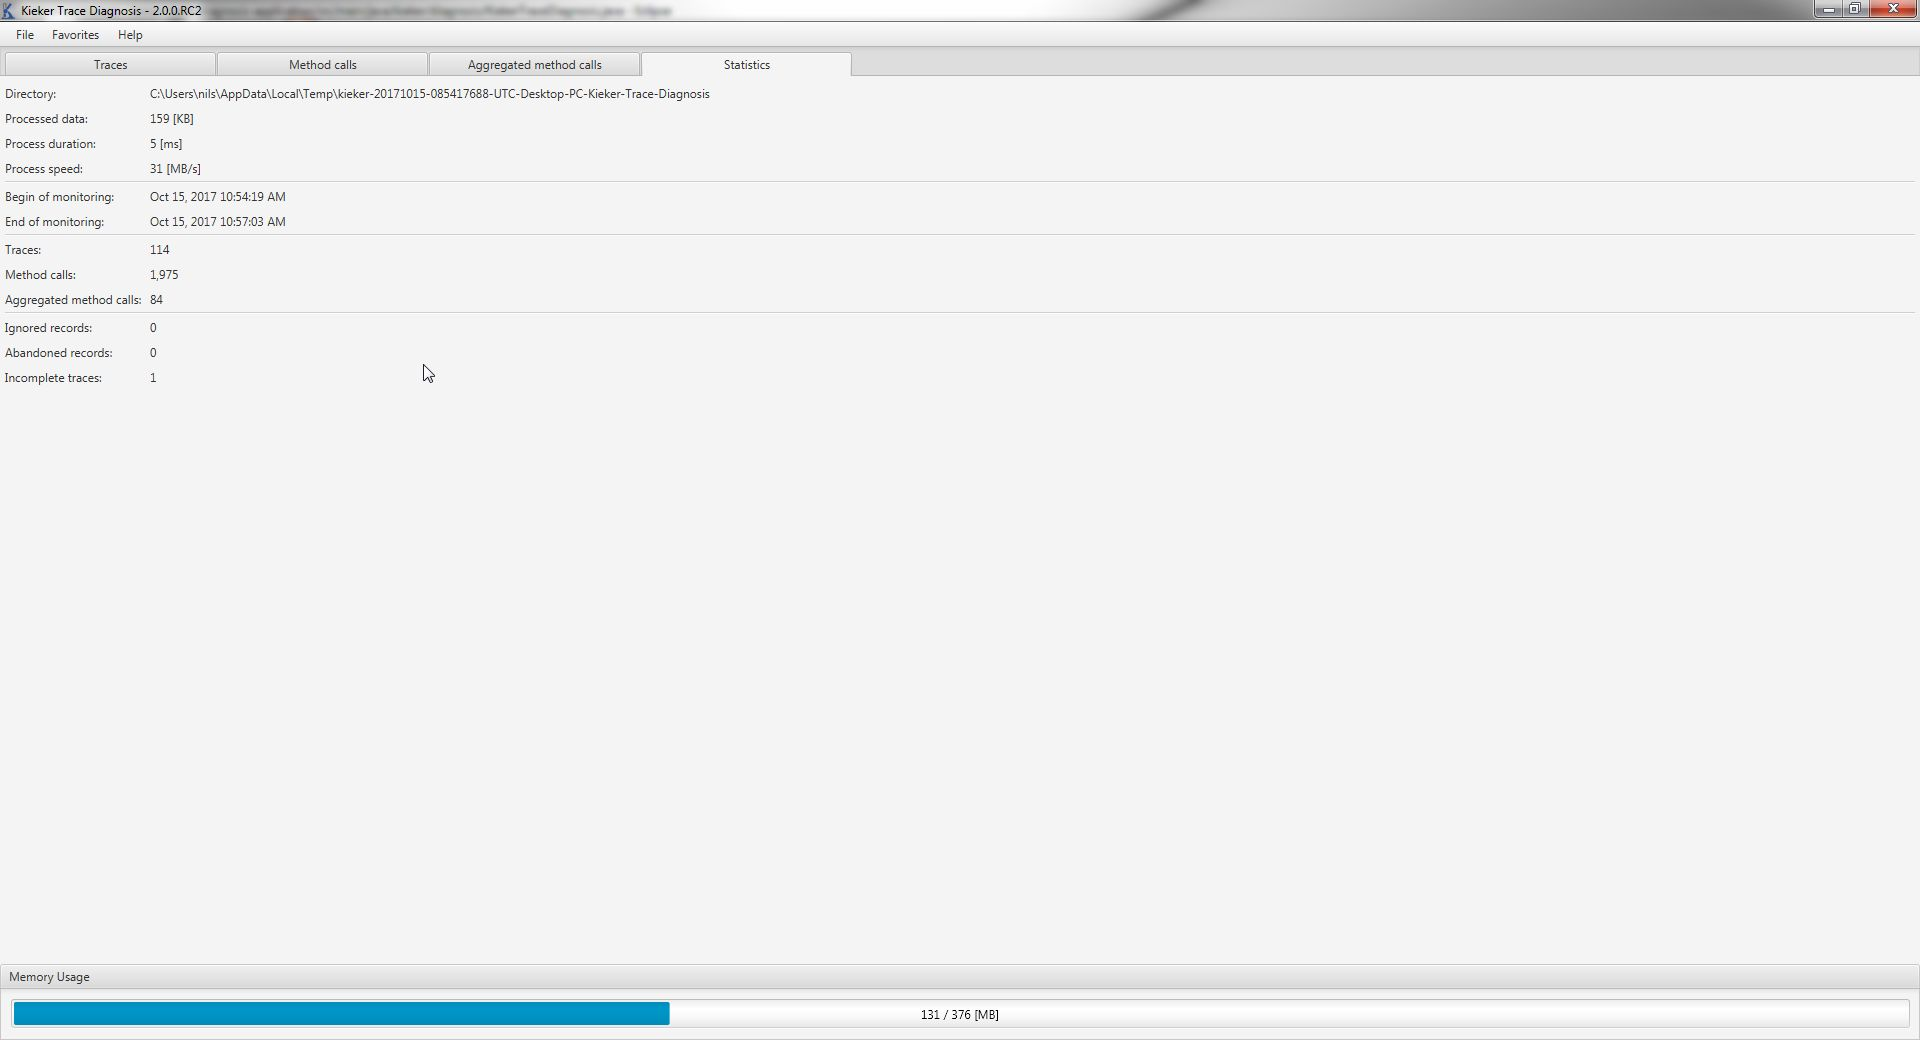
Last but not least we have the statistics view. Although not very useful on its own, it shows you some general statistics about the monitoring logs and the application itself. It helps in gaining a first impression on your logs, as it shows, among other things, the begin and the end of the monitoring, the number of method calls, etc.
Now let us take a look at what you have to do in order to use Kieker Trace Diagnosis for your application. You can download it from https://github.com/kieker-monitoring/kieker-trace-diagnosis-ui/releases. The tool itself is, as mentioned earlier, platform-independent. We provide packages for Windows and Linux, so choose your flavor. You need an updated Java 8 Runtime Environment to start the tool. We recommend an Oracle JDK, although an OpenJDK should work as well (for OpenJDK you might have to install JavaFX explicitly though). The monitoring data has to consist of Kieker’s BeforeOperationEvent, AfterOperationEvent, and AfterOperationFailedEvent records. The data has to be written with one of Kieker’s binary writers.
Kieker Trace Diagnosis is, as usually, licensed under the Apache 2 License.
Try it out and please, let us know about any issues or feature wishes.
Nils Ehmke