Some of the Core Properties of Kieker
- Flexible and Extensible Architecture
- Non-intrusive Instrumentation
- Low Performance Overhead
- Diagnosing Performance Problems
- Analyzing Legacy Systems
Why should software be monitored (with Kieker)?
Static analysis is not sufficient to study the internal behavior of software systems comprehensively. Continuous monitoring allows to gather a system’s actual runtime behavior resulting from production usage profiles. The obtained monitoring data can, for instance, be used for
- Performance evaluation (e.g., bottleneck detection)
- (Self-)adaptation control (e.g., capacity management)
- Application-level failure detection and diagnosis
- Simulation (workload, measurement, logging, and analysis)
- Software maintenance, reverse engineering, modernization
- Service-level management
The Kieker framework provides the necessary monitoring capabilities and comes with tools and libraries for the analysis and visualization of monitored data. Kieker was designed for continuous monitoring in production systems inducing only a very low overhead, which has been evaluated in extensive experiments. Currently, Kieker’s monitoring capabilities are restricted to Java-based applications, but support for other platforms, such as .NET and Visual Basic 6, is currently under development (contact us if you’re interested in this topic). Kieker has already been used for monitoring and profiling in several distributed Java EE industry systems from the telecommunication and business sector, such as CEWE Color, EWE TEL or Nokia Siemens Networks.
Framework overview
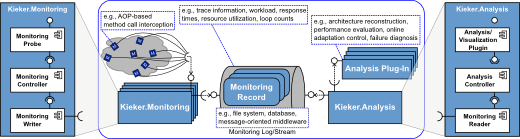
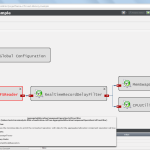
The Kieker.Monitoring component is responsible for program instrumentation, data collection, and logging. Its core is the MonitoringController. The component Kieker.Analysis is responsible for reading, analyzing, and visualizing the monitoring data. Its core is the AnalysisController which manages the life-cycle of the monitoring reader and all analysis plugins. The monitoring and analysis parts of the Kieker framework are composed of subcomponents which represent the different functionalities of the monitoring and analysis tasks.
The monitoring probes create the monitoring records containing the monitoring data and deliver them to the monitoring controller. The monitoring controller employs the monitoring writers to write these monitoring records to a monitoring log or stream. For analyzing purposes, a monitoring reader reads the records from the monitoring log/stream. These records can then be further processed by the analysis plugins.
Framework components and extension points
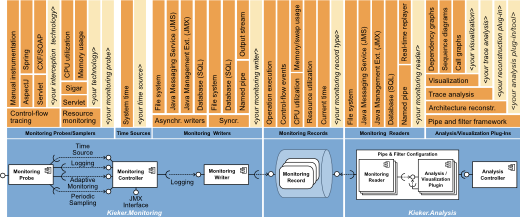
The framework diagram depicts the possible extension points for custom components as well as the components which are already included in the Kieker distribution and detailed below.
- Monitoring writers and corresponding readers for file systems and SQL databases, for in-memory record streams (named pipes), as well writer and readers employing Java Management Extensions (JMX) and Java Messaging Service (JMS) technology. A special reader allows to replay existing persistent monitoring logs, for example to emulate incoming monitoring data—also in real-time.
- A time source utilizing Java’s System.nanoTime() method.
- Monitoring record types allowing to store monitoring data about operation executions (including timing, control-flow, and session information), CPU and resource utilization, memory/swap usage, as well as a record type which can be used to store the current time.
- Monitoring probes: A special feature of Kieker is the ability to monitor distributed) traces of method executions and corresponding timing information. For monitoring this data, Kieker includes monitoring probes employing AspectJ, Java EE Servlet, Spring, and Apache CXF technology. Additionally, Kieker includes probes for (periodic) system-level resource monitoring employing the Sigar library.
- Analysis/visualization plugins can be assembled to pipe-and-filter architectures based on input and output ports.
- The Kieker.TraceAnalysis tool is itself implemented based on a re-usable set of Kieker.Analysis plugins allowing to reconstruct and visualize architectural models of the monitored systems:
- Software architectural diagrams
- Sequence diagrams
- Call trees (single traces, aggregation of trace sets)
- Dependency graphs (container-, component-, and operation-level)
- HTML output of reconstruct system model
- Textual trace and trace equivalence representations
- Execution traces
- Message traces
- Software architectural diagrams
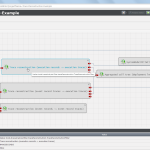
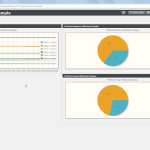
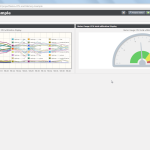
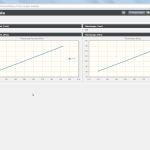
WebGUI
Refer to the WebGUI page for further details.