We performed several experiments to determine the monitoring overhead of Kieker. Preliminary results on earlier versions of Kieker (since 1.0) can be found in the list of publications.
Micro-Benchmarks
In order to facilitate the reproducibility of our results, we include the micro-benchmark and all necessary files into our releases of Kieker in the folder: /examples/OverheadEvaluationMicrobenchmark/. Also included is a README file, detailing the necessary steps to run our benchmarks.
Results (Performance Tunings / Kieker 1.8)
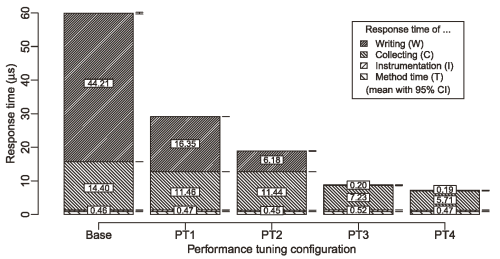
Detailed performance results for our performance tuning experiments are available for download as a data paper. In order to repeat these experiments, access the respective tags (Base, PT1, PT2, and PT3) in our git repository. The sources for PT4 are available upon request. A detailed description of the experiments and further details will be available in an upcoming publication.

Results (Kieker/Palladio Days 2013)
Detailed performance results for our experiments presented at the Symposium on Software Performance(Joint Kieker/Palladio Days 2013) are available for download:
- Data for: Scalable and Live Trace Processing with Kieker Utilizing Cloud Computing
- Data for: A Benchmark Engineering Methodology to Measure the Overhead of Application-Level Monitoring
- Benchmark for: A Benchmark Engineering Methodology to Measure the Overhead of Application-Level Monitoring
Results (Kieker 1.4)
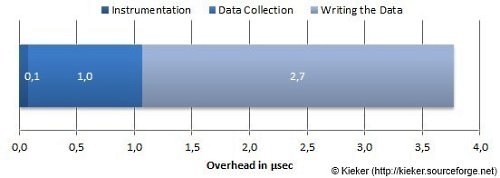
The results presented below apply to Kieker release 1.4.
 On our evaluation system, a typical enterprise server (X6270 Blade Server), the measured monitoring overhead was below 4 µs per monitored operation execution using Kieker’s asynchronous file system writer.
Preliminary results and descriptions of our micro-benchmark are included in the 2009 technical report.
Macro-Benchmarks
In addition to the micro-benchmark, we performed a monitoring overhead analysis with the help of the SPECjEnterprise2010™ benchmark, a benchmark originally developed to measure the performance of JavaEE servers. It simulates a typical JavaEE application, in this case an automobile manufacturer with web browser based access for automobile dealers and web service or EJB-based access for manufacturing sites and suppliers. In order to enable a reproducibility of our results, we include the probes and used instrumentation into our releases of Kieker in the folder /examples/SPECjEnterprise2010/.
Results (Kieker 1.4)
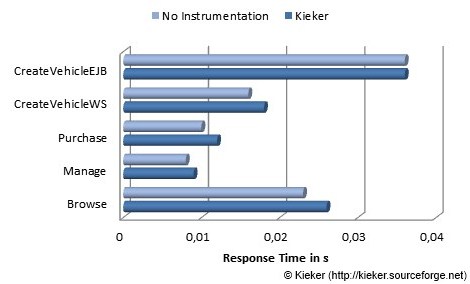
The results presented below apply to Kieker release 1.4.
 We deployed the benchmark, as recommended, on four typical enterprise servers. Our instrumentation resulted in 40 instrumented classes with 138 instrumented methods. With two processor cores assigned to the benchmark system and a transaction rate (tx) of 20 (260 concurrent threads), the average measured monitoring overhead was below 10%.
Refer to our upcoming publications for further details and results.
SPECjEnterprise2010™ is a trademark of the Standard Performance Evaluation Corp. (SPEC). The SPECjEnterprise2010™ results or findings in this publication have not been reviewed or accepted by SPEC, therefore no comparison nor performance inference can be made against any published SPEC result. The official web site for SPECjEnterprise2010™ is located at http://www.spec.org/jEnterprise2010/.