
The content of the following blog entry is taken from our tutorial paper “Everything in Sight: Kieker’s WebGUI in Action” we presented at the Joint Kieker/Palladio Days 2013. If you are interested in more details, we recommend you to take a look at the full paper and the presentation. The WebGUI can be downloaded here.
Introduction
Our Kieker framework allows to create, configure and execute pipe-and-filter analysis networks using a Java API. Using the API to define and configure such networks is possible, but is usually cumbersome and error-prone. Particularly, larger analysis networks, consisting of tens or even hundreds of plugins, can be difficult to handle. Especially maintenance tasks and later modification requests require a suitable graphical editor. Kieker provides a web application for this issue.
However, the assembly and configuration of analysis networks is only one part of the motivation for the web application. The other part is the live visualization of running analyses using widgets, which we designate as displays. Using the application, administrators can observe the behavior of software systems. In combination with anomaly detection filters, it is possible to detect and diagnose performance problems (e.g., long response times) within a system early.
Kieker’s Pipes-and-Filter API
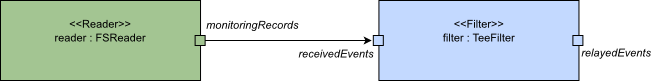
Besides the possibility of creating, configuring, and executing analysis networks, Kieker’s API allows also to save and load the analyses in specific XML configuration files. It is possible to assemble an analysis, save it as a file, and execute it later or import it for further editing into the web application. Look at the following example, consisting of a file system reader and a filter, printing the records on the terminal.
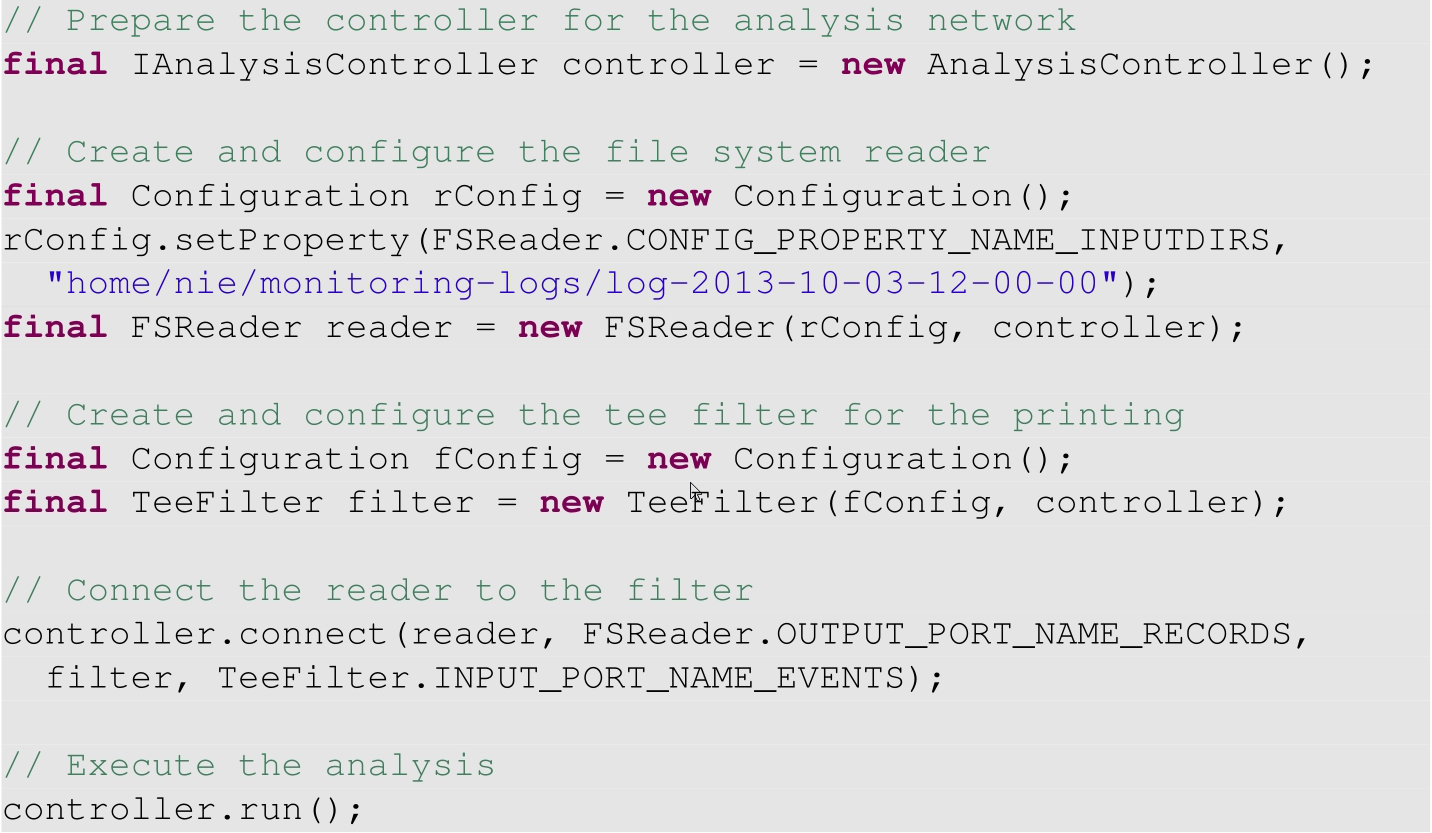
In the following listing, it can be seen that the creating and connecting of only two components using the Java API requires already a lot of code to write and maintain.
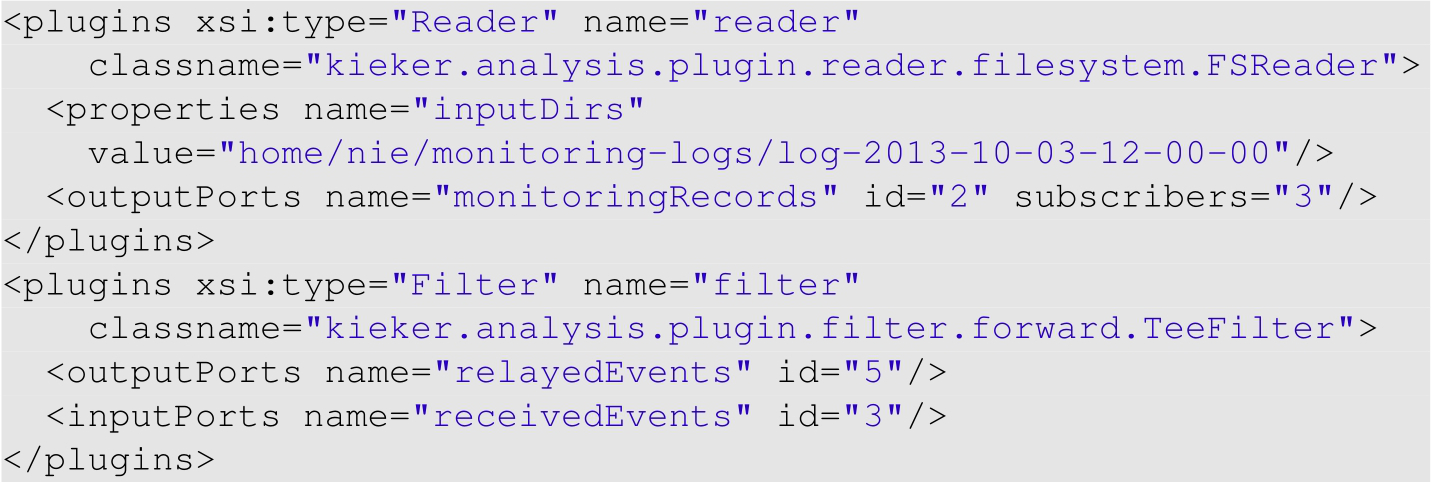
The xml representation (the so called KAX format), which is used by Kieker to save and load analysis networks, is shown in the following (simplified) listing. Unlike the Java code, it can be edited and used without recompilation. However, modifying a XML file without a suitable editor is again very cumbersome and error-prone.
More Details on how to assemble and execute analysis networks can be found in the user guide.
Kieker’s WebGUI
Kieker’s WebGUI is being developed since 2011 and has been part of the Kieker release since version 1.6. It influenced the development of Kieker’s analysis part, which resulted in the pipe-and-filter architecture.
The WebGUI allows to manage multiple projects with separated Java libraries. Analysis networks and cockpit views can be assembled using graphical editors. In the current version, we provide the possibility to visually observe running analyses by displaying results given by the plugins. Furthermore, we implemented a simple access control, including a user management system.
In the following, we use an example to show the application in action. We assemble and configure the example, create some cockpit views, execute the example, and observe the results. Finally, we present the user management page and detail the user hierarchy. For the example, we use a reader to read prepared CPU and memory/swap utilization records from the file system. The records are delayed in real-time, based on their corresponding time stamps. Three different filters are responsible for visualizing the monitored data.
Managing Projects
An overview page allows to view and manage the analysis projects. It is possible to perform usual operations, like, for example, creating, copying, deleting, renaming, and importing (uploading) projects. The page also shows the last editor, the owner, the last date of change, and the current execution state of each project.
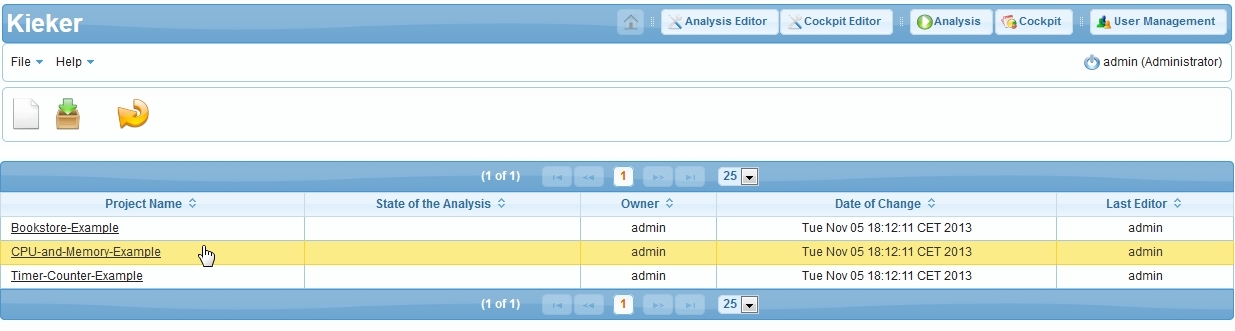
For our example, we simply create a new analysis project and name it “CPU-and-Memory-Example”. The web application creates the necessary files and shows the new project in the project overview list.
Assembling a Kieker Analysis Project
The analysis editor page allows to edit a Kieker project in various ways. A visual graph editor is the centerpiece of this page. It can be used to assemble and modify an analysis network. The layout of the network is automatically generated by a graph layouter from Kieler, a research project from the Real-Time and Embedded Systems Group at Kiel University. The plugins from the Kieker framework are already available in the toolbox on the left side of the page. However, it is possible to upload further Java libraries in order to provide additional plugins.
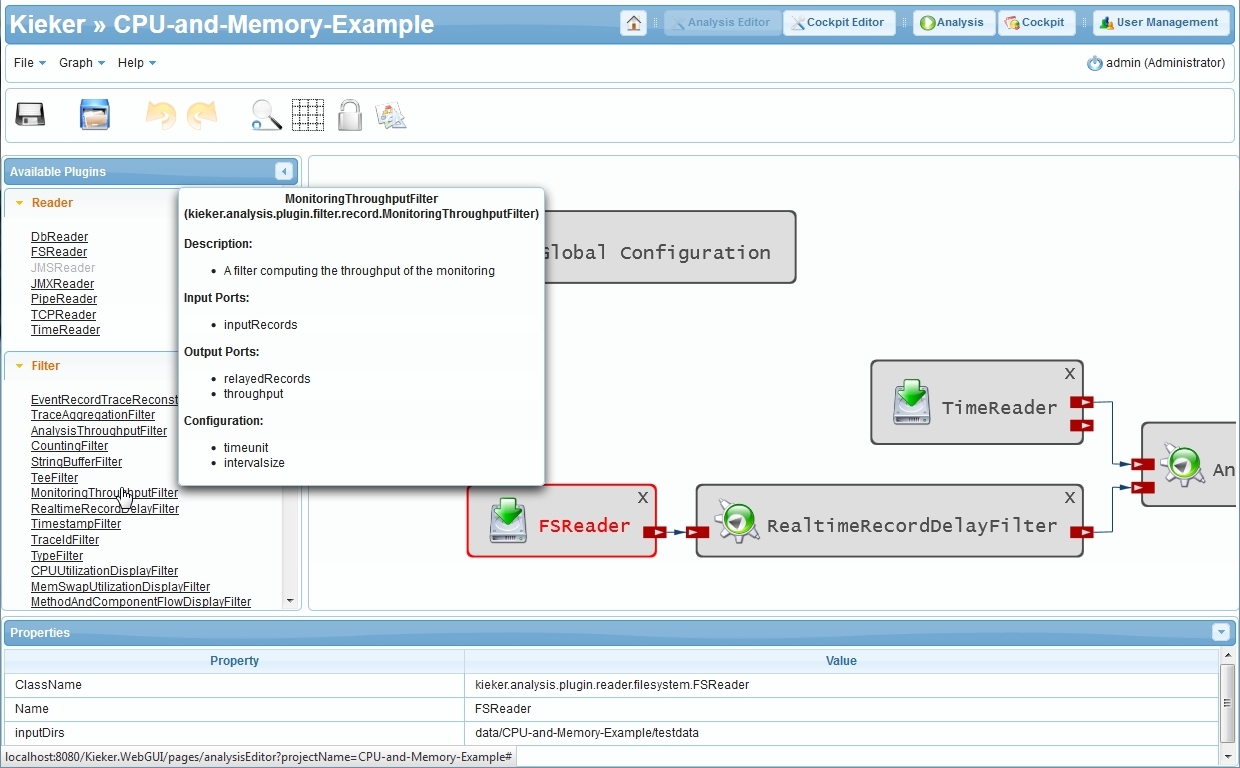
For our example, we add the necessary plugins by clicking on the corresponding links in the toolbox. We add a file system reader and a filter to delay the records in real-time. Additional filters measure the analysis throughput and provide visualizations for the CPU and memory/swap utilizations. A type filter makes sure that the incoming records are sent to the correct visualization filters. As the analysis throughput filter visualizes the throughput per time unit, we also add a time reader, that delivers time stamps in regular, configurable intervals.
Some of the plugins have to be configured. For example, we have to configure the reader to read prepared example monitoring log data from the file system. With a click on the reader, an editor for the properties shows up. It can be used to set the input directory of the reader. The remaining plugins can be configured in a similar manner.
As a last step, we have to connect the plugins with each other. Clicking a plugin’s port reveals an arrow, which can be linked to the port of another plugin. A click on an existing connection can be used to modify or delete the link.
The result of the created and configured example is a KAX (Kieker Analysis XML configuration) file, which can also be used by Kieker’s analysis API and the provided tools to execute the analysis network.
Assembling a Cockpit View
A view on the cockpit editor is shown in the following figure. Similar to the project overview page, we can create, copy, and delete named cockpit views. Cockpit views are filled with displays. They represent the interfaces between plugins and the web application in order to provide visualizations.
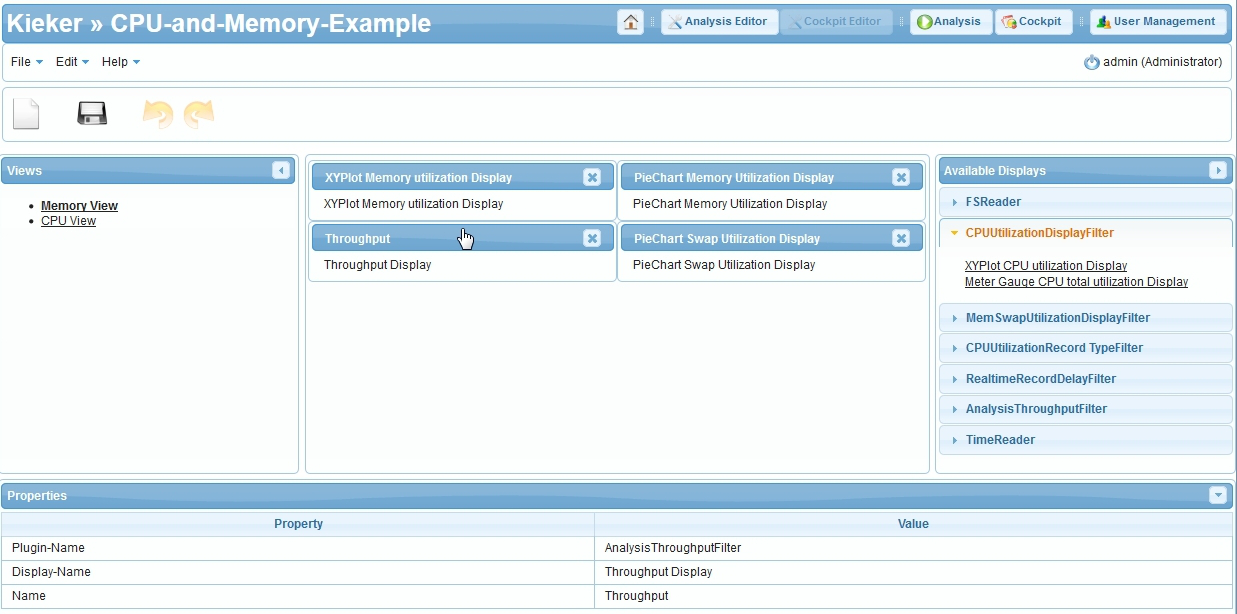
For this example we create two views, Memory View and CPU View. Once selected, it is possible to add the available displays from the filters with a click and to arrange them in a two-columned grid layout.
For the view on the Memory/Swap utilization, we add four displays: one line chart and two pie charts showing the memory and swap utilization, and one rudimentary text display for the analysis throughput. For the view on the CPU utilization, we use two displays: one line chart and a meter gauge.
Controlling the Analysis
The analysis network control is shown in the following figure. On this page, the analysis can be initialized, started, and stopped. It shows the current state (e.g., running or terminated) of the network and presents the corresponding log of the underlying analysis controller. This allows to show, for example, exception stack traces from errors within the analysis controller, which occurred during the initialization. It is planned that this page will contain additional information or controls in later versions of the web application.
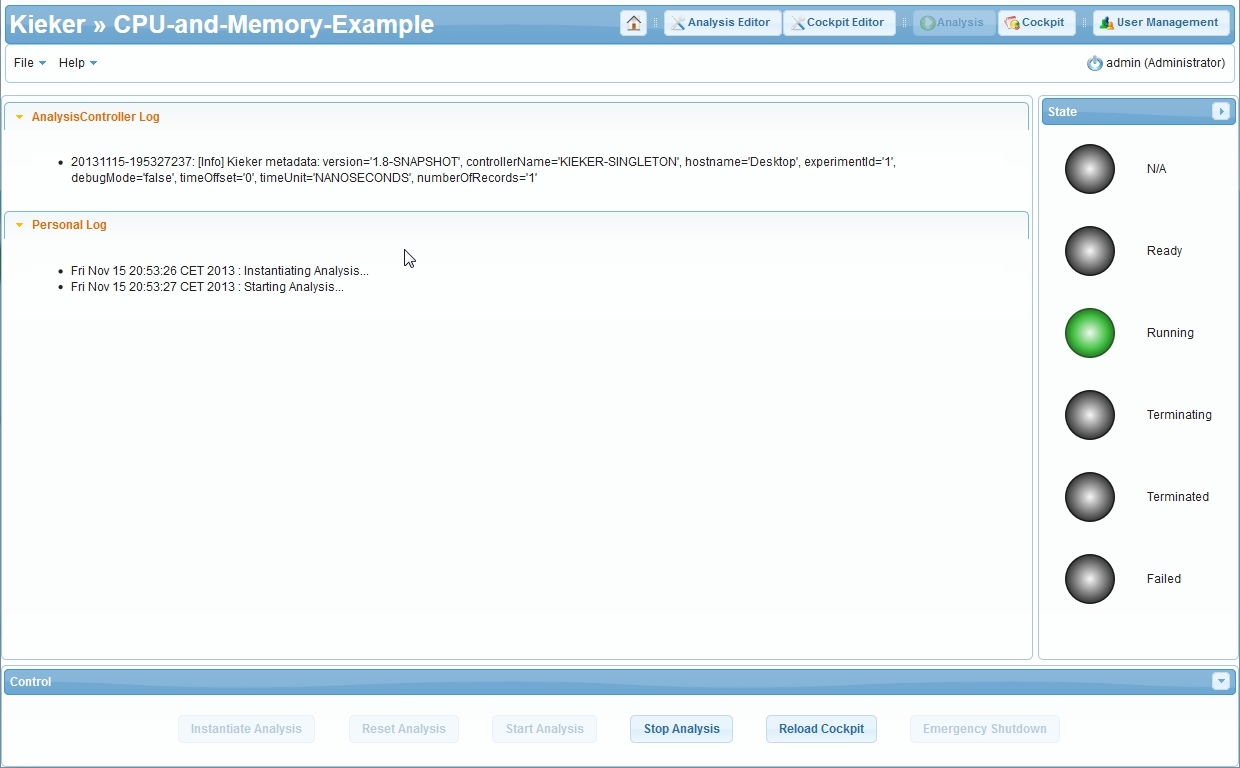
In the context of our example, we simply use this page to initialize and start the analysis network. Note that it is not possible to instantiate multiple instances of the same analysis project at the same time.
Observing a Running Analysis
The cockpit page presents the available views and, once one of the cockpit views has been selected, shows the corresponding visualizations. The four added displays of the Memory/Swap utilization display filter can be seen in the center of the page.
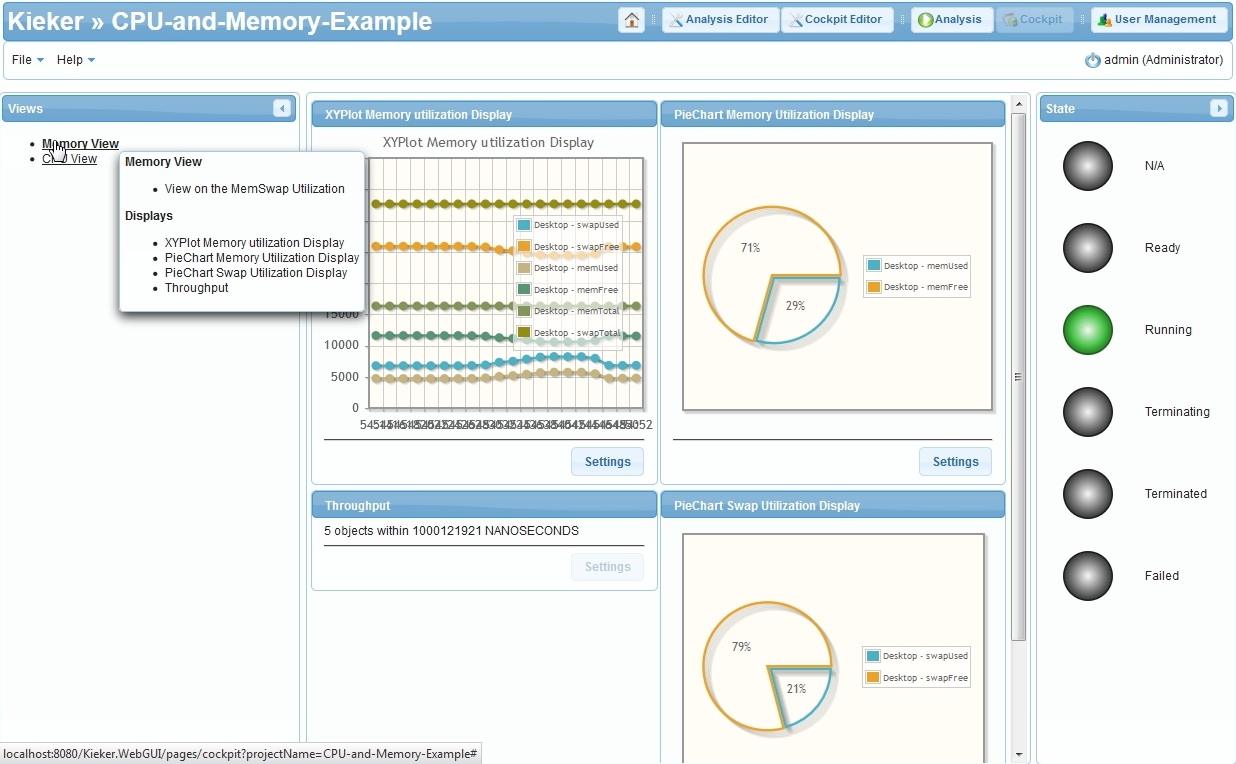
The chart displays can also be configured during runtime by each user. For example, the line chart can be configured to hide some of the shown series or to stack them.
Managing Users
The web application distinguishes three types of users: guests, users, and administrators. Each type of user has different authorizations. This allows, for example, to give a guest access to the cockpits, without the possibility for him to control the running analyses. Guests can view the available analysis projects, the analysis networks, and they can access the cockpit views to observe an analysis. In addition to this, users can create, modify, and control the analysis projects at will. Finally, administrators, can furthermore manage the users within the web application.
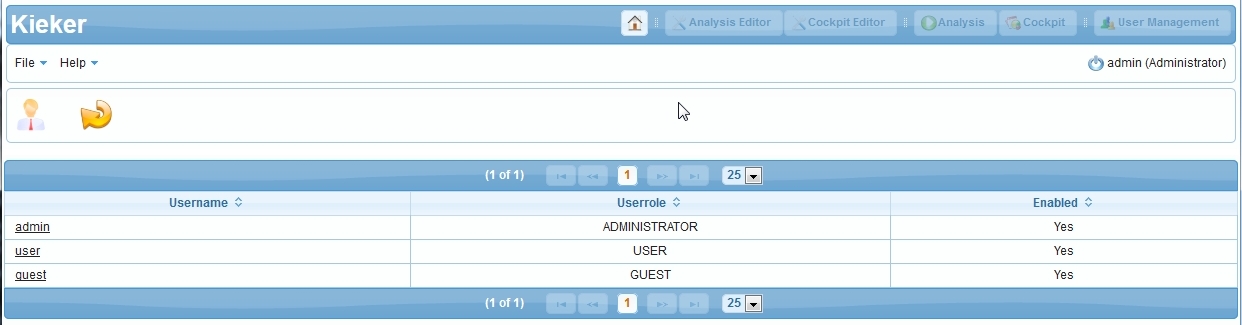
The user management page lists all available users and can be used to create new users or edit the existing ones.
Features and Future
The WebGUI is a graphical tool to comfortably assemble and configure Kieker analysis networks. It can be used to prepare cockpit views and visualize the live results of running analyses. As it is a web application, it can easily be used by multiple users and can be set up for remote access.
Although the web application is still in development, it already provides a number of features and potentials. Furthermore, the development cycle is synchronized with the development of Kieker. The WebGUI is therefore included in the Kieker releases and available here.
Future development of the WebGUI comprises usability, performance, stability and a user manual as well. As the current display API within Kieker is experimental, we will perform further research in this direction as well. We will provide additional visualization types and add new displays to existing analysis components.